Replication of Knittel (2011) 链接到标题
对 Knittel (2011) 部分内容进行复制,暂无稳健性检验部分,原始为 Stata 代码。
library(tidyverse)
library(ggthemes)
library(here)
library(fixest)
library(modelsummary)

# config
mytheme <-theme_classic() + theme(legend.position="bottom")
myscale <- scale_colour_stata("mono")
mystars <- c("***"=0.01, "**"=0.05, "*"=0.10)
-- [1mAttaching packages[22m ---------------------------------------------------------------------------------- tidyverse 1.3.2 --
[32mv[39m [34mggplot2[39m 3.4.0 [32mv[39m [34mpurrr [39m 0.3.5
[32mv[39m [34mtibble [39m 3.1.8 [32mv[39m [34mdplyr [39m 1.0.10
[32mv[39m [34mtidyr [39m 1.2.1 [32mv[39m [34mstringr[39m 1.5.0
[32mv[39m [34mreadr [39m 2.1.3 [32mv[39m [34mforcats[39m 0.5.2
-- [1mConflicts[22m ------------------------------------------------------------------------------------- tidyverse_conflicts() --
[31mx[39m [34mdplyr[39m::[32mfilter()[39m masks [34mstats[39m::filter()
[31mx[39m [34mdplyr[39m::[32mlag()[39m masks [34mstats[39m::lag()
here() starts at D:/zhou/projects/rep_knittel_2011
# load data
steroids <- haven::read_dta(here("original", "data", "Steroids_AER_data_post.dta"))

vehicle_80_06 <- steroids |>
    mutate(type_year = case_when(
        d_truck == 0 & year == 1980 ~ "Cars in 1980",
        d_truck == 0 & year == 2006 ~ "Cars in 2006",
        d_truck == 1 & year == 1980 ~ "Trucks in 1980",
        d_truck == 1 & year == 2006 ~ "Trucks in 2006",
        TRUE ~ "others"
    )) |>
    filter(fuel == "G" & outlier == 0 & type_year != "others")

cars <- steroids |> filter(outlier == 0 & d_truck == 0)
trucks <- steroids |> filter(outlier == 0 & d_truck == 1)


datawizard::data_codebook(steroids)
Density Plots 链接到标题
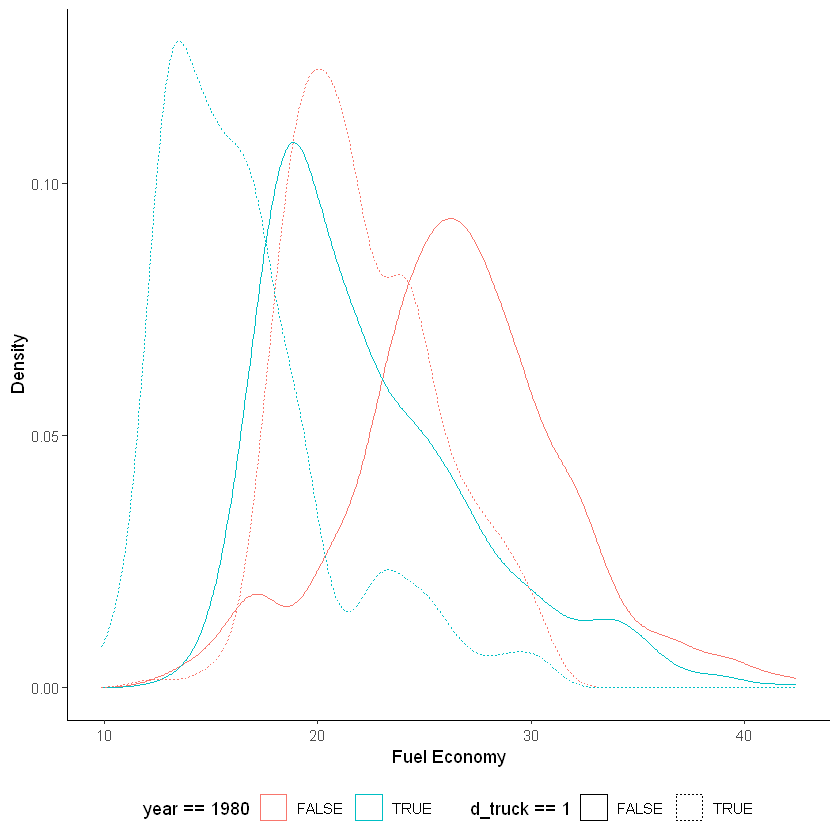
Fuel Economy
vehicle_80_06 |>
    ggplot() + geom_density(aes(mpg, linetype = d_truck == 1, color = year == 1980)) +
    labs(x = "Fuel Economy", y = "Density") + mytheme
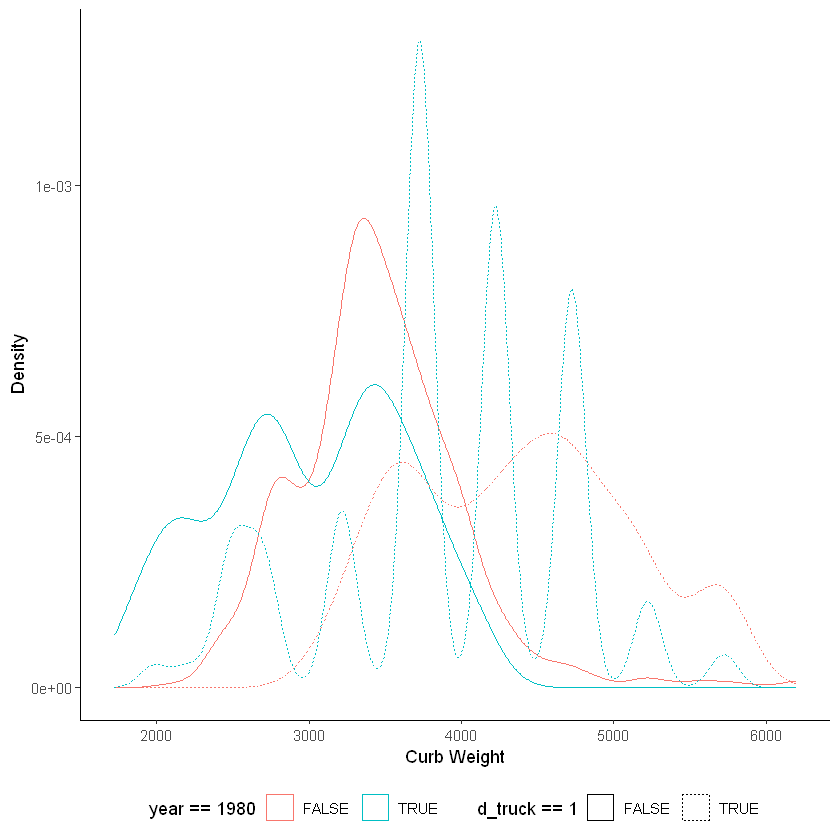
Curb Weight
vehicle_80_06 |>
    ggplot() + geom_density(aes(curbwt, linetype = d_truck == 1, color = year == 1980)) +
    labs(x = "Curb Weight", y = "Density") + mytheme
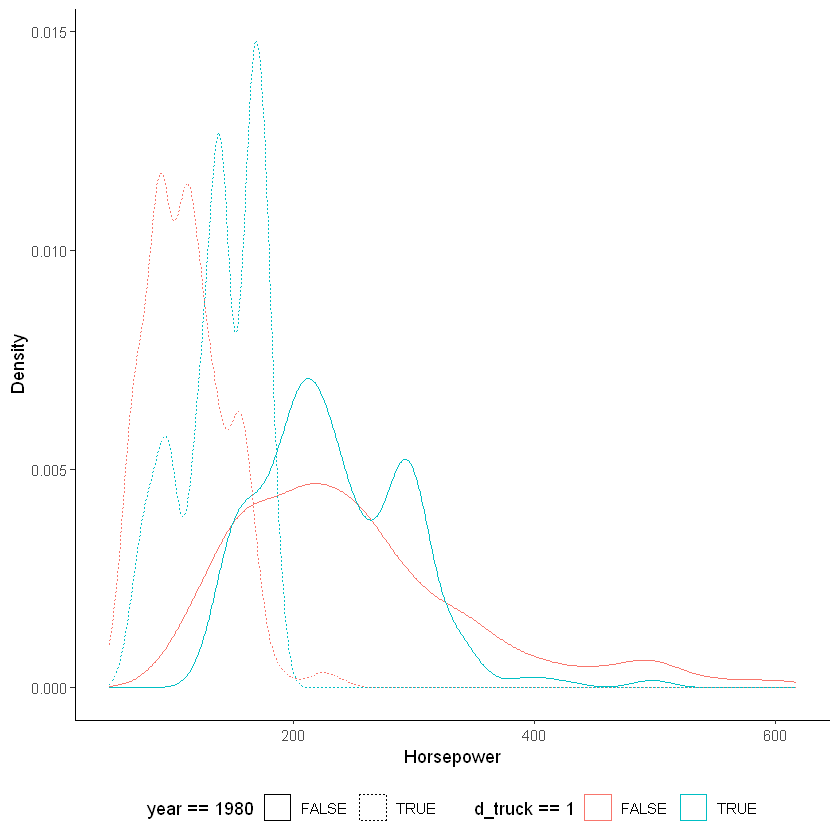
Hoursepwer
vehicle_80_06 |>
    ggplot() + geom_density(aes(hp, linetype = year == 1980, color = d_truck == 1)) +
    labs(x = "Horsepower", y = "Density") + mytheme
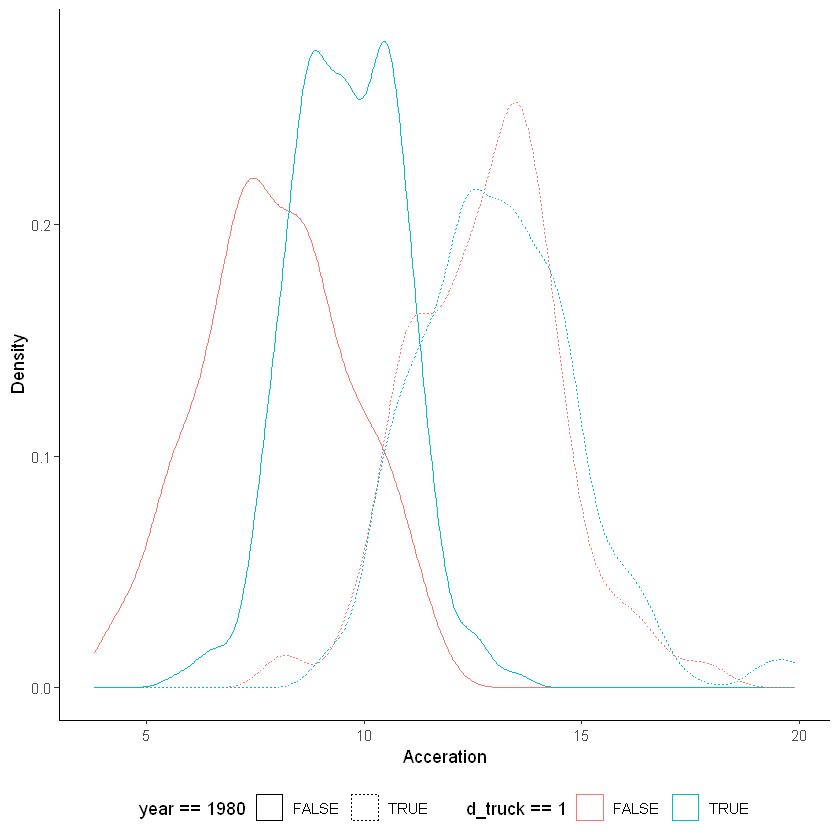
Acceleration
vehicle_80_06 |>
    ggplot() + geom_density(aes(accel, linetype = year == 1980, color = d_truck == 1)) +
    labs(x = "Acceration", y = "Density") + mytheme
Isoquants 链接到标题
Cars 链接到标题
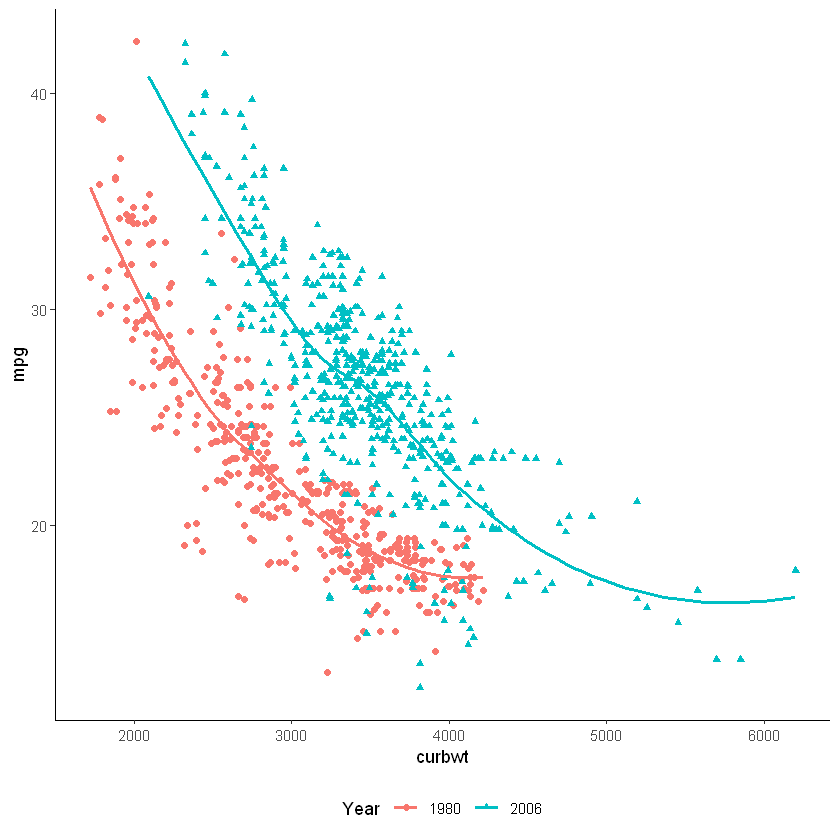
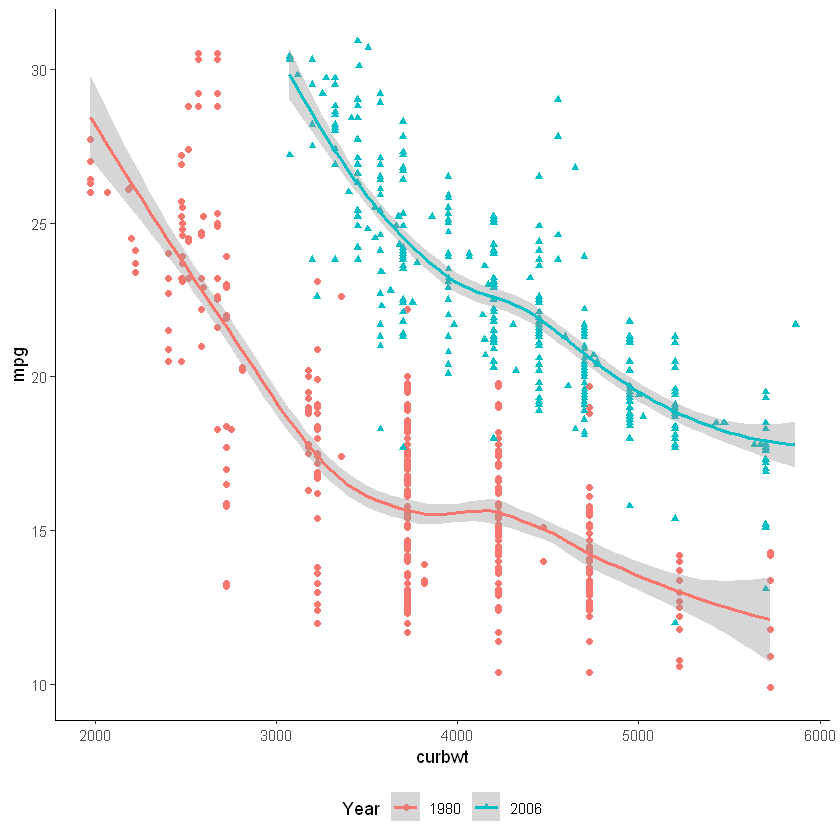
Fuel economy v.s. Weight
cars_mpglt50 <- vehicle_80_06 |>
    filter(mpg < 50 & d_truck == 0) |>
    mutate(Year = as.character(year))

ggplot(cars_mpglt50, aes(curbwt, mpg,
                         shape = Year, color = Year)) +
    geom_point() +
    geom_smooth(se = FALSE) +
    mytheme
[1m[22m`geom_smooth()` using method = 'loess' and formula = 'y ~ x'
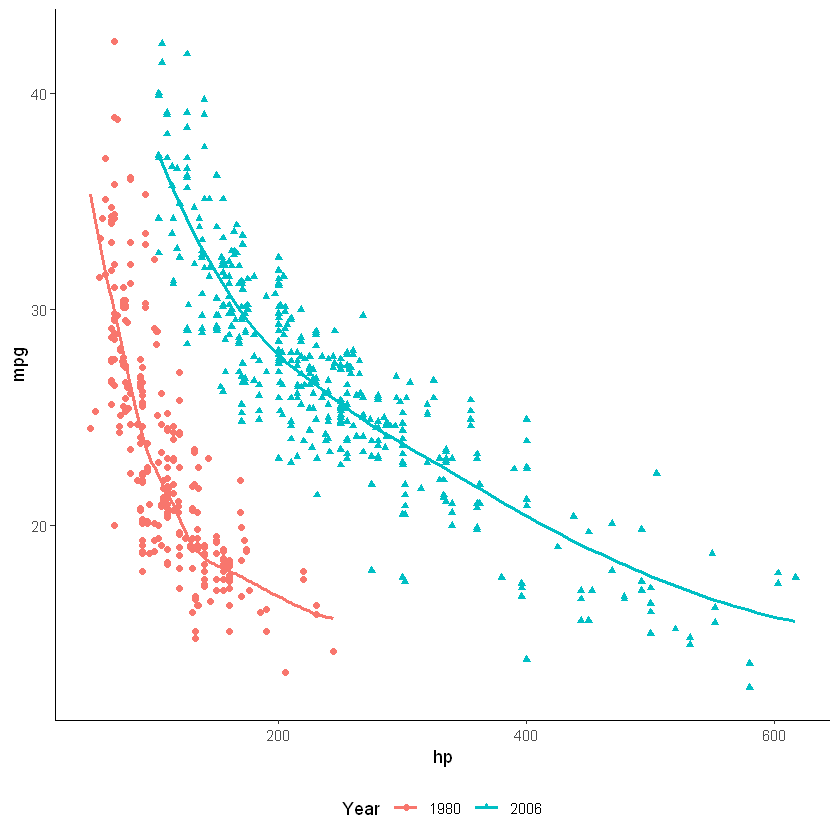
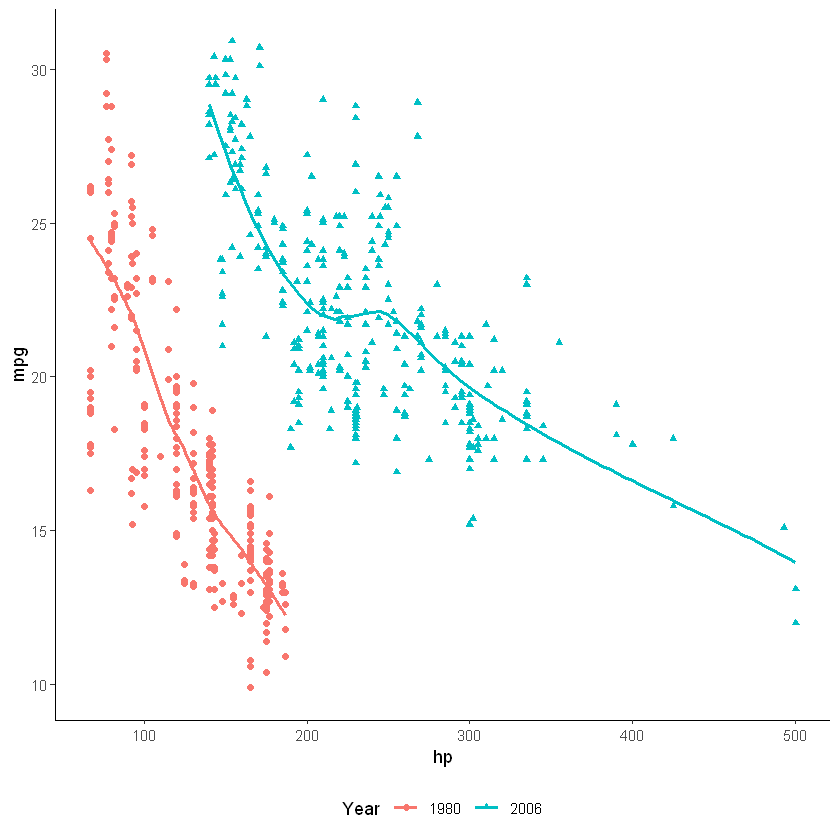
Fuel economy v.s. Horsepower
ggplot(cars_mpglt50, aes(hp, mpg, shape = Year, color = Year)) +
    geom_point() +
    geom_smooth(se = FALSE) +
    mytheme
[1m[22m`geom_smooth()` using method = 'loess' and formula = 'y ~ x'
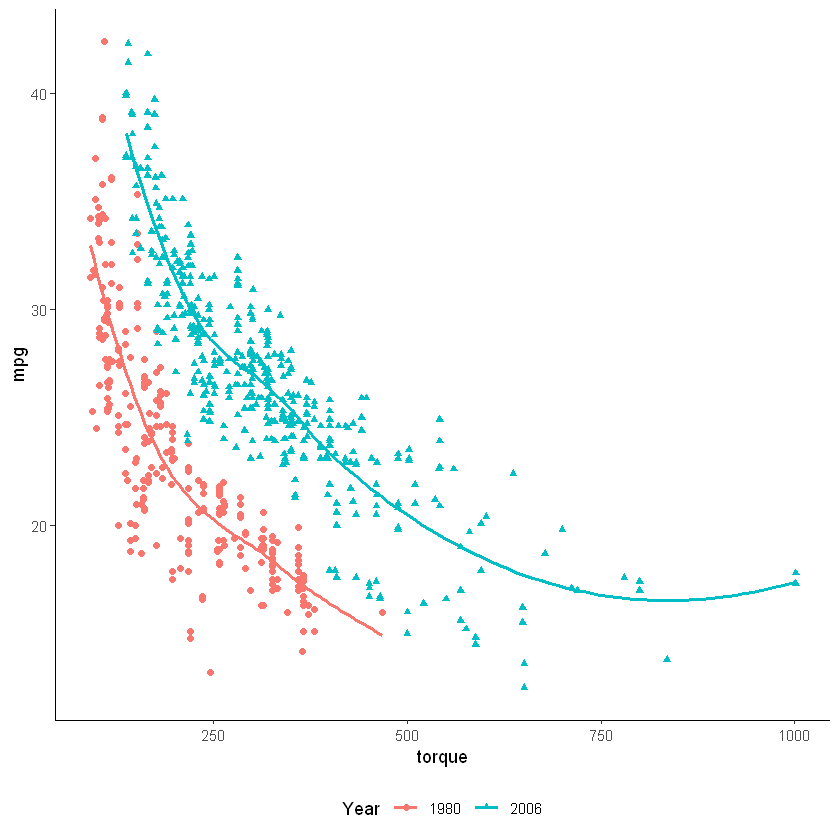
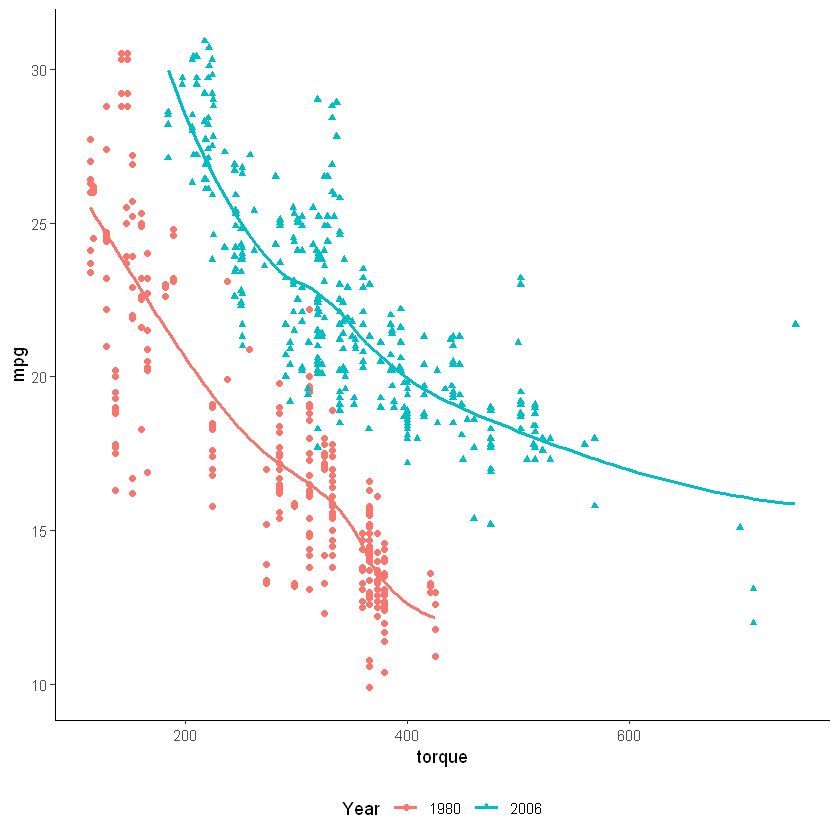
Fuel economy v.s. Torque
ggplot(cars_mpglt50, aes(torque, mpg, shape = Year, color = Year)) +
    geom_point() +
    geom_smooth(se = FALSE) +
    mytheme
[1m[22m`geom_smooth()` using method = 'loess' and formula = 'y ~ x'
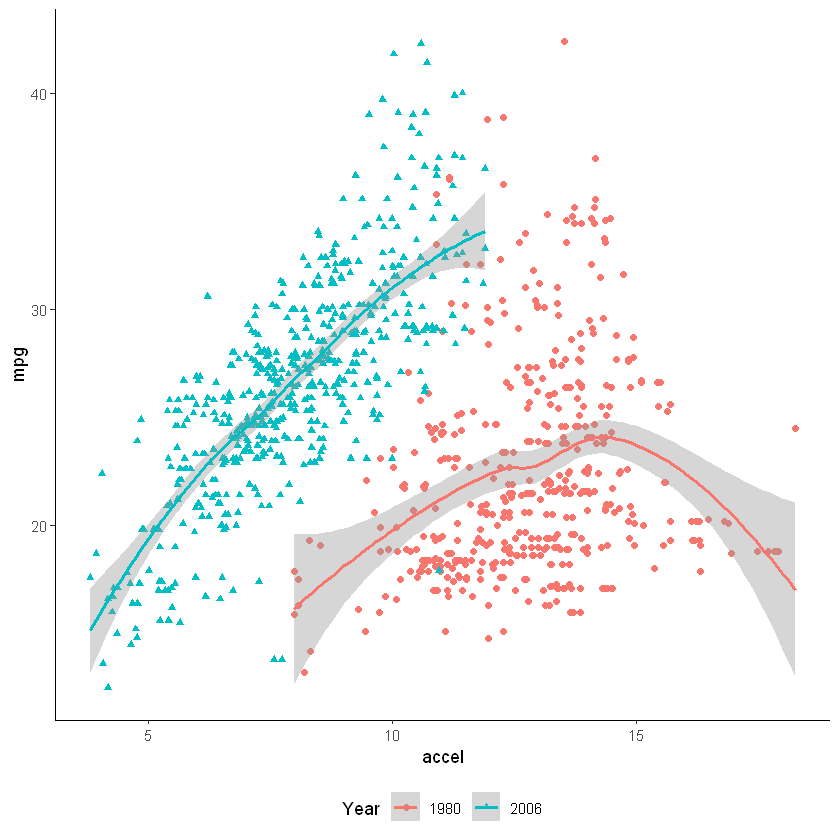
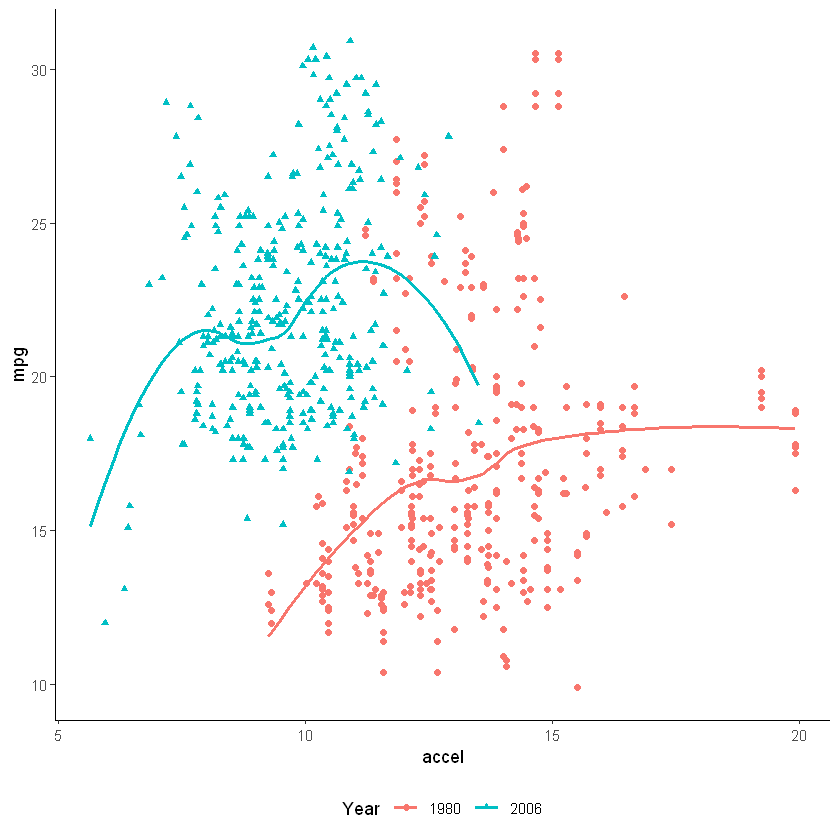
Fuel economy v.s. Acceleration
ggplot(cars_mpglt50, aes(accel, mpg, shape = Year, color = Year)) +
    geom_point() +
    geom_smooth() +
    mytheme
[1m[22m`geom_smooth()` using method = 'loess' and formula = 'y ~ x'
Trucks 链接到标题
Fuel economy v.s. Weight
trucks_mpglt50 <- vehicle_80_06 |>
    filter(d_truck == 1 & mpg < 50) |>
    mutate(Year = as.character(year))

ggplot(trucks_mpglt50, aes(curbwt, mpg, shape = Year, color = Year)) +
    geom_point() +
    geom_smooth() +
    mytheme
[1m[22m`geom_smooth()` using method = 'loess' and formula = 'y ~ x'
Fuel economy v.s. Horsepower
ggplot(trucks_mpglt50, aes(hp, mpg, shape = Year, color = Year)) +
    geom_point() +
    geom_smooth(se = FALSE) +
    mytheme
[1m[22m`geom_smooth()` using method = 'loess' and formula = 'y ~ x'
Fuel economy v.s. Torque
ggplot(trucks_mpglt50, aes(torque, mpg, shape = Year, color = Year)) +
    geom_point() +
    geom_smooth(se = FALSE) +
    mytheme
[1m[22m`geom_smooth()` using method = 'loess' and formula = 'y ~ x'
Fuel economy v.s. Acceleration
ggplot(trucks_mpglt50, aes(accel, mpg, shape = Year, color = Year)) +
    geom_point() +
    geom_smooth(se = FALSE) +
    mytheme
[1m[22m`geom_smooth()` using method = 'loess' and formula = 'y ~ x'
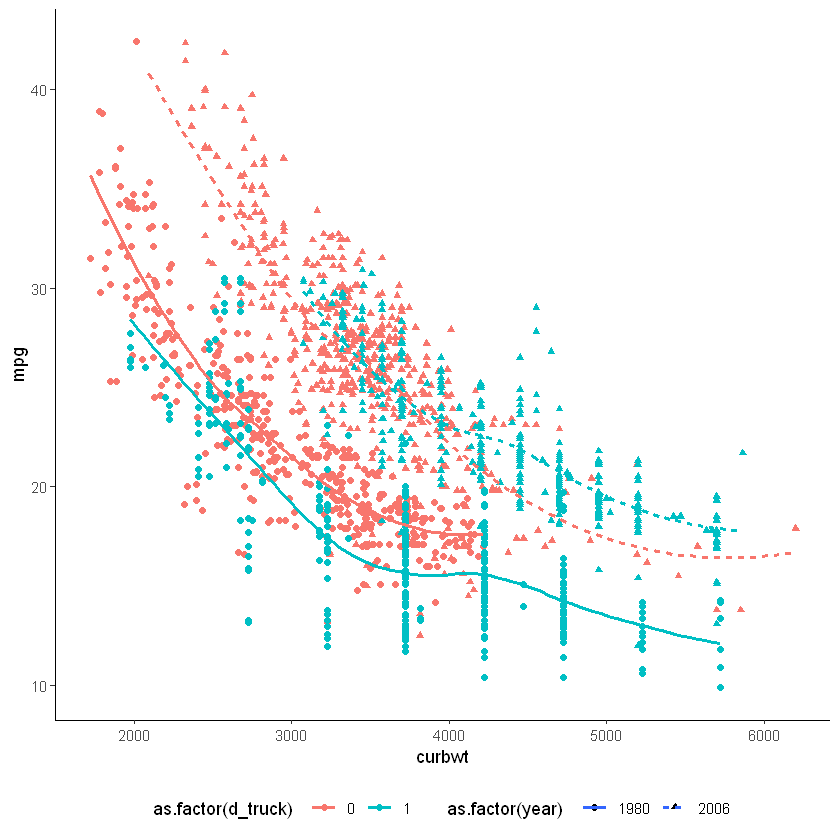
Cars v. Trucks 链接到标题
vehicle_80_06 |>
    ggplot(aes(curbwt, mpg, color = as.factor(d_truck), shape = as.factor(year), linetype = as.factor(year))) +
    geom_point() +
    geom_smooth(se = FALSE) +
    mytheme
[1m[22m`geom_smooth()` using method = 'loess' and formula = 'y ~ x'
Cars 链接到标题
Cobb-Douglass
# use feols for speed
# use dummy variable on purpose
cars_cd1 <- feols(lmpg ~ lcurbwt + lhp + ltorque + d_manual + time_d_manual + d_diesel + d_turbo + d_super + i(year), cars)
cars_cd2 <- feols(lmpg ~ lcurbwt + lhp + ltorque + d_manual + time_d_manual + d_diesel + d_turbo + d_super + i(year) + i(mfr), cars)
cars_cd3 <- feols(lmpg ~ lcurbwt + lhp + ltorque + d_manual + time_d_manual + d_diesel + i(year) + i(mfr), cars)
Translog
cars_tl1 <- feols(lmpg ~ lcurbwt + lhp + ltorque + lhp2 + lcurbwt2 + ltorque2 + lcurbwt_lhp + lcurbwt_ltorque +  lhp_ltorque + d_manual + time_d_manual + d_diesel + d_turbo + d_super + i(year), cars)
cars_tl2 <- feols(lmpg ~ lcurbwt + lhp + ltorque + lhp2 + lcurbwt2 + ltorque2 + lcurbwt_lhp + lcurbwt_ltorque +  lhp_ltorque + d_manual + time_d_manual + d_diesel + d_turbo + d_super + i(year) + i(mfr), cars)
cars_tl3 <- feols(lmpg ~ lcurbwt + lhp + ltorque + lhp2 + lcurbwt2 + ltorque2 + lcurbwt_lhp + lcurbwt_ltorque +  lhp_ltorque + d_manual + time_d_manual + d_diesel + i(year) + i(mfr), cars)
Table 2 链接到标题
modelsummary(
    list(cars_cd1, cars_cd2, cars_cd3, cars_tl1, cars_tl2, cars_tl3),
    output = "jupyter",
    stars = mystars,
    vcov = ~mfr,
    drop = "year|mfr"
)
| Model 1 | Model 2 | Model 3 | Model 4 | Model 5 | Model 6 | |
|---|---|---|---|---|---|---|
| (Intercept) | 7.857*** | 7.686*** | 7.828*** | 10.061** | 11.451*** | 12.183*** |
| (0.254) | (0.200) | (0.193) | (4.040) | (3.887) | (3.744) | |
| lcurbwt | -0.398*** | -0.383*** | -0.419*** | 0.462 | 0.197 | -0.043 |
| (0.046) | (0.032) | (0.029) | (1.271) | (1.261) | (1.254) | |
| lhp | -0.324*** | -0.268*** | -0.262*** | -2.549*** | -3.092*** | -2.937*** |
| (0.047) | (0.039) | (0.043) | (0.803) | (0.693) | (0.774) | |
| ltorque | -0.019 | -0.064** | -0.045 | -0.041 | 0.212 | 0.191 |
| (0.038) | (0.030) | (0.035) | (0.757) | (0.583) | (0.673) | |
| d_manual | 0.087*** | 0.101*** | 0.102*** | 0.076*** | 0.086*** | 0.087*** |
| (0.013) | (0.013) | (0.013) | (0.013) | (0.012) | (0.012) | |
| time_d_manual | -0.004*** | -0.004*** | -0.004*** | -0.003*** | -0.003*** | -0.003*** |
| (0.0007) | (0.0007) | (0.0007) | (0.0007) | (0.0007) | (0.0007) | |
| d_diesel | 0.196*** | 0.212*** | 0.229*** | 0.257*** | 0.248*** | 0.272*** |
| (0.018) | (0.017) | (0.023) | (0.019) | (0.025) | (0.033) | |
| d_turbo | 0.025** | 0.051*** | 0.017** | 0.051*** | ||
| (0.010) | (0.010) | (0.007) | (0.009) | |||
| d_super | 0.055*** | 0.034*** | 0.057*** | 0.038** | ||
| (0.017) | (0.011) | (0.020) | (0.016) | |||
| lhp2 | -0.180* | -0.099* | -0.151** | |||
| (0.106) | (0.054) | (0.060) | ||||
| lcurbwt2 | -0.208* | -0.165 | -0.154 | |||
| (0.117) | (0.115) | (0.118) | ||||
| ltorque2 | -0.030 | 0.025 | -0.022 | |||
| (0.123) | (0.065) | (0.066) | ||||
| lcurbwt_lhp | 0.473*** | 0.489*** | 0.477*** | |||
| (0.139) | (0.129) | (0.147) | ||||
| lcurbwt_ltorque | 0.016 | -0.059 | -0.044 | |||
| (0.108) | (0.122) | (0.137) | ||||
| lhp_ltorque | 0.047 | -0.017 | 0.070 | |||
| (0.197) | (0.059) | (0.057) | ||||
| Num.Obs. | 14423 | 14423 | 14423 | 14423 | 14423 | 14423 |
| R2 | 0.838 | 0.883 | 0.879 | 0.847 | 0.890 | 0.886 |
| R2 Adj. | 0.838 | 0.882 | 0.878 | 0.846 | 0.889 | 0.886 |
| AIC | -29072.0 | -33644.6 | -33202.3 | -29824.4 | -34536.1 | -34062.0 |
| BIC | -28806.8 | -33099.1 | -32672.0 | -29513.8 | -33945.1 | -33486.1 |
| RMSE | 0.09 | 0.07 | 0.08 | 0.09 | 0.07 | 0.07 |
| Std.Errors | by: mfr | by: mfr | by: mfr | by: mfr | by: mfr | by: mfr |
| * p < 0.1, ** p < 0.05, *** p < 0.01 |
Table 3 链接到标题
modelsummary(
    list(cars_cd1, cars_cd2, cars_cd3, cars_tl1, cars_tl2, cars_tl3),
    output = "jupyter",
    stars = mystars,
    vcov = ~mfr,
    keep = "year"
)
| Model 1 | Model 2 | Model 3 | Model 4 | Model 5 | Model 6 | |
|---|---|---|---|---|---|---|
| year = 1981 | 0.055*** | 0.055*** | 0.055*** | 0.054*** | 0.053*** | 0.053*** |
| (0.009) | (0.009) | (0.010) | (0.009) | (0.008) | (0.009) | |
| year = 1982 | 0.095*** | 0.095*** | 0.096*** | 0.092*** | 0.090*** | 0.091*** |
| (0.012) | (0.012) | (0.013) | (0.011) | (0.011) | (0.011) | |
| year = 1983 | 0.134*** | 0.131*** | 0.132*** | 0.128*** | 0.125*** | 0.125*** |
| (0.013) | (0.014) | (0.015) | (0.012) | (0.013) | (0.013) | |
| year = 1984 | 0.160*** | 0.156*** | 0.159*** | 0.150*** | 0.148*** | 0.150*** |
| (0.012) | (0.013) | (0.013) | (0.009) | (0.010) | (0.010) | |
| year = 1985 | 0.188*** | 0.181*** | 0.185*** | 0.174*** | 0.171*** | 0.174*** |
| (0.011) | (0.011) | (0.012) | (0.010) | (0.009) | (0.009) | |
| year = 1986 | 0.215*** | 0.211*** | 0.215*** | 0.200*** | 0.199*** | 0.201*** |
| (0.010) | (0.010) | (0.011) | (0.010) | (0.009) | (0.009) | |
| year = 1987 | 0.225*** | 0.220*** | 0.224*** | 0.207*** | 0.209*** | 0.211*** |
| (0.012) | (0.011) | (0.012) | (0.013) | (0.011) | (0.011) | |
| year = 1988 | 0.251*** | 0.242*** | 0.245*** | 0.233*** | 0.231*** | 0.232*** |
| (0.014) | (0.012) | (0.012) | (0.015) | (0.013) | (0.013) | |
| year = 1989 | 0.260*** | 0.252*** | 0.255*** | 0.239*** | 0.239*** | 0.239*** |
| (0.012) | (0.010) | (0.012) | (0.012) | (0.010) | (0.010) | |
| year = 1990 | 0.278*** | 0.267*** | 0.270*** | 0.257*** | 0.254*** | 0.254*** |
| (0.013) | (0.011) | (0.012) | (0.012) | (0.010) | (0.011) | |
| year = 1991 | 0.291*** | 0.279*** | 0.281*** | 0.268*** | 0.265*** | 0.264*** |
| (0.013) | (0.012) | (0.014) | (0.010) | (0.011) | (0.012) | |
| year = 1992 | 0.304*** | 0.293*** | 0.294*** | 0.280*** | 0.278*** | 0.276*** |
| (0.015) | (0.015) | (0.016) | (0.013) | (0.014) | (0.014) | |
| year = 1993 | 0.335*** | 0.322*** | 0.322*** | 0.311*** | 0.304*** | 0.302*** |
| (0.017) | (0.016) | (0.018) | (0.014) | (0.015) | (0.015) | |
| year = 1994 | 0.355*** | 0.340*** | 0.339*** | 0.330*** | 0.323*** | 0.320*** |
| (0.018) | (0.016) | (0.017) | (0.016) | (0.015) | (0.016) | |
| year = 1995 | 0.386*** | 0.371*** | 0.370*** | 0.358*** | 0.351*** | 0.348*** |
| (0.017) | (0.016) | (0.018) | (0.014) | (0.015) | (0.016) | |
| year = 1996 | 0.398*** | 0.380*** | 0.378*** | 0.368*** | 0.361*** | 0.356*** |
| (0.017) | (0.014) | (0.016) | (0.013) | (0.013) | (0.013) | |
| year = 1997 | 0.407*** | 0.393*** | 0.392*** | 0.379*** | 0.373*** | 0.370*** |
| (0.019) | (0.017) | (0.019) | (0.015) | (0.014) | (0.015) | |
| year = 1998 | 0.420*** | 0.409*** | 0.409*** | 0.392*** | 0.389*** | 0.387*** |
| (0.019) | (0.019) | (0.021) | (0.016) | (0.017) | (0.018) | |
| year = 1999 | 0.417*** | 0.411*** | 0.410*** | 0.388*** | 0.392*** | 0.389*** |
| (0.019) | (0.019) | (0.021) | (0.016) | (0.017) | (0.018) | |
| year = 2000 | 0.426*** | 0.423*** | 0.421*** | 0.396*** | 0.405*** | 0.401*** |
| (0.020) | (0.020) | (0.022) | (0.016) | (0.018) | (0.019) | |
| year = 2001 | 0.438*** | 0.434*** | 0.434*** | 0.409*** | 0.415*** | 0.413*** |
| (0.020) | (0.020) | (0.023) | (0.017) | (0.018) | (0.020) | |
| year = 2002 | 0.454*** | 0.451*** | 0.450*** | 0.424*** | 0.431*** | 0.429*** |
| (0.024) | (0.023) | (0.025) | (0.019) | (0.021) | (0.022) | |
| year = 2003 | 0.474*** | 0.467*** | 0.467*** | 0.445*** | 0.447*** | 0.446*** |
| (0.024) | (0.025) | (0.028) | (0.022) | (0.023) | (0.025) | |
| year = 2004 | 0.483*** | 0.474*** | 0.475*** | 0.455*** | 0.453*** | 0.452*** |
| (0.025) | (0.024) | (0.026) | (0.021) | (0.022) | (0.024) | |
| year = 2005 | 0.495*** | 0.488*** | 0.489*** | 0.469*** | 0.467*** | 0.467*** |
| (0.024) | (0.024) | (0.026) | (0.021) | (0.023) | (0.024) | |
| year = 2006 | 0.522*** | 0.512*** | 0.511*** | 0.494*** | 0.486*** | 0.485*** |
| (0.028) | (0.027) | (0.029) | (0.023) | (0.026) | (0.027) | |
| Num.Obs. | 14423 | 14423 | 14423 | 14423 | 14423 | 14423 |
| R2 | 0.838 | 0.883 | 0.879 | 0.847 | 0.890 | 0.886 |
| R2 Adj. | 0.838 | 0.882 | 0.878 | 0.846 | 0.889 | 0.886 |
| AIC | -29072.0 | -33644.6 | -33202.3 | -29824.4 | -34536.1 | -34062.0 |
| BIC | -28806.8 | -33099.1 | -32672.0 | -29513.8 | -33945.1 | -33486.1 |
| RMSE | 0.09 | 0.07 | 0.08 | 0.09 | 0.07 | 0.07 |
| Std.Errors | by: mfr | by: mfr | by: mfr | by: mfr | by: mfr | by: mfr |
| * p < 0.1, ** p < 0.05, *** p < 0.01 |
Trucks 链接到标题
Cobb-Douglass
tr_cd1 <- feols(lmpg ~ lcurbwt + lhp + ltorque + d_manual + time_d_manual + d_diesel + d_turbo + d_super + i(year), trucks)
tr_cd2 <- feols(lmpg ~ lcurbwt + lhp + ltorque + d_manual + time_d_manual + d_diesel + d_turbo + d_super + i(year) + i(mfr), trucks)
tr_cd3 <- feols(lmpg ~ lcurbwt + lhp + ltorque + d_manual + time_d_manual + d_diesel + i(year) + i(mfr), trucks)
Translog
tr_tl1 <- feols(lmpg ~ lcurbwt + lhp + ltorque + lhp2 + lcurbwt2 + ltorque2 + lcurbwt_lhp + lcurbwt_ltorque +  lhp_ltorque + d_manual + time_d_manual + d_diesel + d_turbo + d_super + i(year), trucks)
tr_tl2 <- feols(lmpg ~ lcurbwt + lhp + ltorque + lhp2 + lcurbwt2 + ltorque2 + lcurbwt_lhp + lcurbwt_ltorque +  lhp_ltorque + d_manual + time_d_manual + d_diesel + d_turbo + d_super + i(year) + i(mfr), trucks)
tr_tl3 <- feols(lmpg ~ lcurbwt + lhp + ltorque + lhp2 + lcurbwt2 + ltorque2 + lcurbwt_lhp + lcurbwt_ltorque +  lhp_ltorque + d_manual + time_d_manual + d_diesel + i(year) + i(mfr), trucks)
Table 4 链接到标题
modelsummary(
    list(tr_cd1, tr_cd2, tr_cd3, tr_tl1, tr_tl2, tr_tl3),
    output = "jupyter",
    stars = mystars,
    vcov = ~mfr,
    drop = "year|mfr"
)
| Model 1 | Model 2 | Model 3 | Model 4 | Model 5 | Model 6 | |
|---|---|---|---|---|---|---|
| (Intercept) | 7.541*** | 7.726*** | 7.728*** | 8.781 | 4.911 | 5.049 |
| (0.333) | (0.378) | (0.393) | (5.902) | (5.066) | (5.177) | |
| lcurbwt | -0.363*** | -0.355*** | -0.356*** | 0.280 | 1.431 | 1.391 |
| (0.052) | (0.040) | (0.043) | (1.534) | (1.172) | (1.222) | |
| lhp | -0.047 | -0.071* | -0.071* | -0.847 | -1.308** | -1.283** |
| (0.043) | (0.041) | (0.041) | (0.704) | (0.561) | (0.595) | |
| ltorque | -0.277*** | -0.303*** | -0.303*** | -0.908 | -0.780 | -0.791 |
| (0.048) | (0.054) | (0.052) | (1.037) | (0.839) | (0.838) | |
| d_manual | 0.103*** | 0.094*** | 0.094*** | 0.099*** | 0.086*** | 0.086*** |
| (0.021) | (0.016) | (0.016) | (0.022) | (0.017) | (0.017) | |
| time_d_manual | -0.005*** | -0.005*** | -0.005*** | -0.005*** | -0.004*** | -0.004*** |
| (0.001) | (0.0008) | (0.0008) | (0.001) | (0.0009) | (0.0009) | |
| d_diesel | 0.267*** | 0.244*** | 0.245*** | 0.278*** | 0.252*** | 0.255*** |
| (0.019) | (0.017) | (0.023) | (0.019) | (0.016) | (0.019) | |
| d_turbo | 0.002 | 0.004 | 0.014 | 0.025 | ||
| (0.054) | (0.062) | (0.042) | (0.049) | |||
| d_super | -0.038 | -0.007 | -0.047 | -0.016 | ||
| (0.042) | (0.045) | (0.038) | (0.038) | |||
| lhp2 | 0.011 | 0.055 | 0.052 | |||
| (0.156) | (0.146) | (0.145) | ||||
| lcurbwt2 | -0.197** | -0.245*** | -0.242*** | |||
| (0.094) | (0.063) | (0.067) | ||||
| ltorque2 | -0.405*** | -0.388*** | -0.384*** | |||
| (0.111) | (0.130) | (0.129) | ||||
| lcurbwt_lhp | -0.050 | -0.064 | -0.063 | |||
| (0.111) | (0.092) | (0.093) | ||||
| lcurbwt_ltorque | 0.505*** | 0.454*** | 0.450*** | |||
| (0.148) | (0.116) | (0.115) | ||||
| lhp_ltorque | 0.199 | 0.218 | 0.217 | |||
| (0.283) | (0.269) | (0.267) | ||||
| Num.Obs. | 12572 | 12572 | 12572 | 12572 | 12572 | 12572 |
| R2 | 0.768 | 0.796 | 0.796 | 0.778 | 0.805 | 0.805 |
| R2 Adj. | 0.767 | 0.795 | 0.795 | 0.777 | 0.804 | 0.804 |
| AIC | -20796.9 | -22373.3 | -22376.9 | -21361.9 | -22953.4 | -22948.6 |
| BIC | -20536.5 | -21949.3 | -21967.8 | -21056.9 | -22484.8 | -22494.8 |
| RMSE | 0.11 | 0.10 | 0.10 | 0.10 | 0.10 | 0.10 |
| Std.Errors | by: mfr | by: mfr | by: mfr | by: mfr | by: mfr | by: mfr |
| * p < 0.1, ** p < 0.05, *** p < 0.01 |
Table 5 链接到标题
modelsummary(
    list(tr_cd1, tr_cd2, tr_cd3, tr_tl1, tr_tl2, tr_tl3),
    output = "jupyter",
    stars = mystars,
    vcov = ~mfr,
    keep = "year"
)
| Model 1 | Model 2 | Model 3 | Model 4 | Model 5 | Model 6 | |
|---|---|---|---|---|---|---|
| year = 1981 | 0.069*** | 0.067*** | 0.067*** | 0.066*** | 0.063*** | 0.063*** |
| (0.012) | (0.011) | (0.011) | (0.012) | (0.011) | (0.011) | |
| year = 1982 | 0.102*** | 0.098*** | 0.098*** | 0.098*** | 0.094*** | 0.094*** |
| (0.016) | (0.016) | (0.016) | (0.015) | (0.015) | (0.015) | |
| year = 1983 | 0.132*** | 0.120*** | 0.121*** | 0.130*** | 0.117*** | 0.117*** |
| (0.016) | (0.015) | (0.015) | (0.016) | (0.015) | (0.015) | |
| year = 1984 | 0.136*** | 0.120*** | 0.120*** | 0.136*** | 0.118*** | 0.118*** |
| (0.020) | (0.016) | (0.016) | (0.020) | (0.016) | (0.016) | |
| year = 1985 | 0.146*** | 0.130*** | 0.130*** | 0.140*** | 0.123*** | 0.124*** |
| (0.011) | (0.009) | (0.009) | (0.013) | (0.012) | (0.012) | |
| year = 1986 | 0.169*** | 0.155*** | 0.155*** | 0.161*** | 0.148*** | 0.148*** |
| (0.012) | (0.011) | (0.011) | (0.014) | (0.013) | (0.014) | |
| year = 1987 | 0.174*** | 0.163*** | 0.163*** | 0.168*** | 0.157*** | 0.157*** |
| (0.013) | (0.011) | (0.011) | (0.015) | (0.013) | (0.013) | |
| year = 1988 | 0.205*** | 0.195*** | 0.195*** | 0.201*** | 0.190*** | 0.190*** |
| (0.013) | (0.010) | (0.010) | (0.014) | (0.011) | (0.011) | |
| year = 1989 | 0.207*** | 0.201*** | 0.201*** | 0.201*** | 0.195*** | 0.195*** |
| (0.010) | (0.008) | (0.009) | (0.011) | (0.009) | (0.009) | |
| year = 1990 | 0.221*** | 0.215*** | 0.215*** | 0.216*** | 0.211*** | 0.211*** |
| (0.021) | (0.017) | (0.018) | (0.023) | (0.020) | (0.020) | |
| year = 1991 | 0.222*** | 0.219*** | 0.219*** | 0.217*** | 0.214*** | 0.214*** |
| (0.011) | (0.010) | (0.010) | (0.014) | (0.013) | (0.013) | |
| year = 1992 | 0.258*** | 0.252*** | 0.252*** | 0.250*** | 0.244*** | 0.244*** |
| (0.018) | (0.016) | (0.016) | (0.019) | (0.016) | (0.016) | |
| year = 1993 | 0.258*** | 0.254*** | 0.254*** | 0.250*** | 0.245*** | 0.246*** |
| (0.028) | (0.025) | (0.025) | (0.029) | (0.025) | (0.026) | |
| year = 1994 | 0.283*** | 0.277*** | 0.277*** | 0.275*** | 0.269*** | 0.270*** |
| (0.027) | (0.023) | (0.025) | (0.027) | (0.022) | (0.023) | |
| year = 1995 | 0.283*** | 0.280*** | 0.280*** | 0.275*** | 0.272*** | 0.272*** |
| (0.032) | (0.028) | (0.030) | (0.033) | (0.028) | (0.029) | |
| year = 1996 | 0.288*** | 0.285*** | 0.285*** | 0.301*** | 0.294*** | 0.296*** |
| (0.034) | (0.025) | (0.028) | (0.025) | (0.017) | (0.019) | |
| year = 1997 | 0.324*** | 0.327*** | 0.327*** | 0.336*** | 0.336*** | 0.336*** |
| (0.025) | (0.019) | (0.020) | (0.015) | (0.011) | (0.011) | |
| year = 1998 | 0.328*** | 0.324*** | 0.324*** | 0.323*** | 0.316*** | 0.317*** |
| (0.032) | (0.025) | (0.026) | (0.030) | (0.023) | (0.024) | |
| year = 1999 | 0.342*** | 0.347*** | 0.347*** | 0.341*** | 0.342*** | 0.342*** |
| (0.036) | (0.031) | (0.031) | (0.039) | (0.032) | (0.032) | |
| year = 2000 | 0.367*** | 0.374*** | 0.374*** | 0.353*** | 0.356*** | 0.356*** |
| (0.033) | (0.027) | (0.027) | (0.034) | (0.029) | (0.029) | |
| year = 2001 | 0.338*** | 0.343*** | 0.343*** | 0.326*** | 0.325*** | 0.325*** |
| (0.032) | (0.027) | (0.027) | (0.034) | (0.028) | (0.028) | |
| year = 2002 | 0.347*** | 0.352*** | 0.352*** | 0.332*** | 0.332*** | 0.332*** |
| (0.034) | (0.028) | (0.028) | (0.036) | (0.029) | (0.030) | |
| year = 2003 | 0.369*** | 0.369*** | 0.369*** | 0.353*** | 0.347*** | 0.347*** |
| (0.044) | (0.038) | (0.038) | (0.045) | (0.038) | (0.038) | |
| year = 2004 | 0.410*** | 0.413*** | 0.413*** | 0.390*** | 0.385*** | 0.385*** |
| (0.044) | (0.038) | (0.038) | (0.045) | (0.039) | (0.040) | |
| year = 2005 | 0.463*** | 0.466*** | 0.467*** | 0.440*** | 0.433*** | 0.434*** |
| (0.036) | (0.029) | (0.030) | (0.036) | (0.029) | (0.030) | |
| year = 2006 | 0.492*** | 0.497*** | 0.497*** | 0.469*** | 0.465*** | 0.466*** |
| (0.037) | (0.032) | (0.033) | (0.036) | (0.030) | (0.031) | |
| Num.Obs. | 12572 | 12572 | 12572 | 12572 | 12572 | 12572 |
| R2 | 0.768 | 0.796 | 0.796 | 0.778 | 0.805 | 0.805 |
| R2 Adj. | 0.767 | 0.795 | 0.795 | 0.777 | 0.804 | 0.804 |
| AIC | -20796.9 | -22373.3 | -22376.9 | -21361.9 | -22953.4 | -22948.6 |
| BIC | -20536.5 | -21949.3 | -21967.8 | -21056.9 | -22484.8 | -22494.8 |
| RMSE | 0.11 | 0.10 | 0.10 | 0.10 | 0.10 | 0.10 |
| Std.Errors | by: mfr | by: mfr | by: mfr | by: mfr | by: mfr | by: mfr |
| * p < 0.1, ** p < 0.05, *** p < 0.01 |
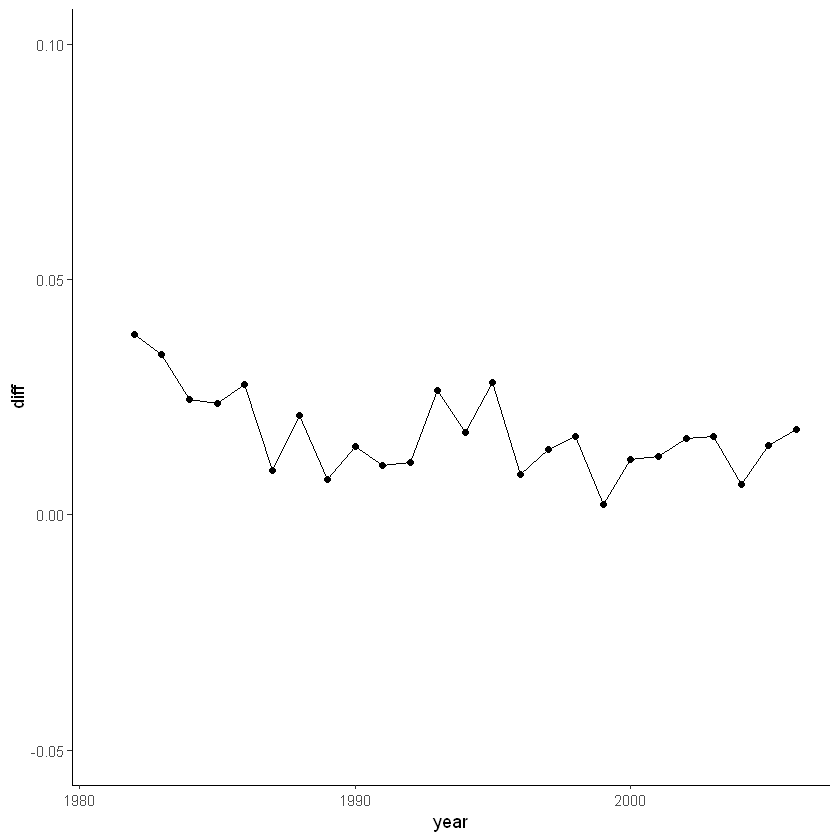
Figure 7
coeftable(cars_tl3, keep = "year") |>
    as_tibble(rownames = "year") |>
    mutate(diff = Estimate - dplyr::lag(Estimate)) |>
    extract(year, "year", "(\\d+)", convert = TRUE) |>
    ggplot(aes(year, diff)) + geom_point() + geom_line() + mytheme + ylim(-0.05, 0.1)
Warning message:
"[1m[22mRemoved 1 rows containing missing values (`geom_point()`)."
Warning message:
"[1m[22mRemoved 1 row containing missing values (`geom_line()`)."